Showing posts with label company review. Show all posts

Tuesday, August 4, 2026

Intel Company Review — The 18A Foundry Turnaround Bet

Intel once came close to being synonymous with the PC processor, but that description misses the transformation the company is attempting in 2026. Intel sells processors such as Core and Xeon while trying to offer advanced process technology and packaging to outside customers through Intel Foundry. Its history of combining design and manufacturing is both an asset and a structure in which factory investment and process delays can weigh heavily on earnings.

This Intel company review is not a simple CPU performance comparison. It examines whether Intel under CEO Lip-Bu Tan can connect PC and server cash flow, the Intel 18A process, U.S. manufacturing, and an external foundry business into one turnaround strategy. The latest detailed financial baseline is the official first quarter ended March 28, 2026, while the 2025 Form 10-K provides the annual operating structure.

Official Intel logo distributed by Intel Press Hub for editorial reporting

<Official Intel corporate logo, credit Intel Corporation 1.1>

Intel is fundamentally a dual product-and-factory business

The core of Intel Products is the Client Computing Group, or CCG, and Data Center and AI, or DCAI. CCG covers Core processors and commercial PC platforms for notebooks and desktops, while DCAI includes Xeon CPUs and data-center products. PCs now compete on an AI experience combining the NPU, GPU, and CPU as well as performance and battery life. GPUs may command attention in data centers, but CPUs still run operating systems, process data, and coordinate networks and accelerators.

Intel Foundry combines technology development, wafer fabrication, assembly and test, and advanced packaging. The difficulty is that most Foundry revenue still comes from manufacturing Intel's own products. According to the 2025 Form 10-K, external revenue was only $307 million of Intel Foundry's $17.826 billion in 2025 revenue. Until the outside-customer business becomes material, internal volume supports factory utilization while the competitiveness of Intel's products determines much of the factory economics.

Business layer Representative assets Customer value Intel's challenge
Client Core Ultra, vPro, Arc PC performance, power, and local AI Compete with Arm, AMD, and Apple for upgrades
Data center Xeon 6 and 6+, networking and acceleration General compute and AI-system coordination Defend CPU budget in a GPU-centered market
Manufacturing Intel 18A, Fab 52 Leading-edge U.S. logic production Stabilize yield, cost, and schedules
Packaging Foveros and advanced packaging Integrate dissimilar chiplets Win an external design ecosystem
Software oneAPI, OpenVINO, and tools Develop and deploy across compute engines Preserve consistency across hardware generations

This dual structure differs from the fabless NVIDIA AI factory strategy. NVIDIA concentrates on ecosystems and system design while outsourcing fabrication; Intel is responsible for both product demand and factory utilization. If manufacturing stabilizes, however, Intel can fabricate customer chips while feeding process and packaging knowledge into its own products quickly. The advantage and the risk have the same root.

Intel 18A tests transistor, power-delivery, and packaging changes together

Intel 18A is more than a process name with a smaller number. First, RibbonFET is a gate-all-around structure in which the gate surrounds the channel on several sides, improving current control as dimensions shrink. Second, PowerVia is backside power delivery, separating signal wiring and power delivery onto different sides of the wafer. Third, Foveros combines chiplets with different functions vertically and horizontally inside one package to build a complete system.
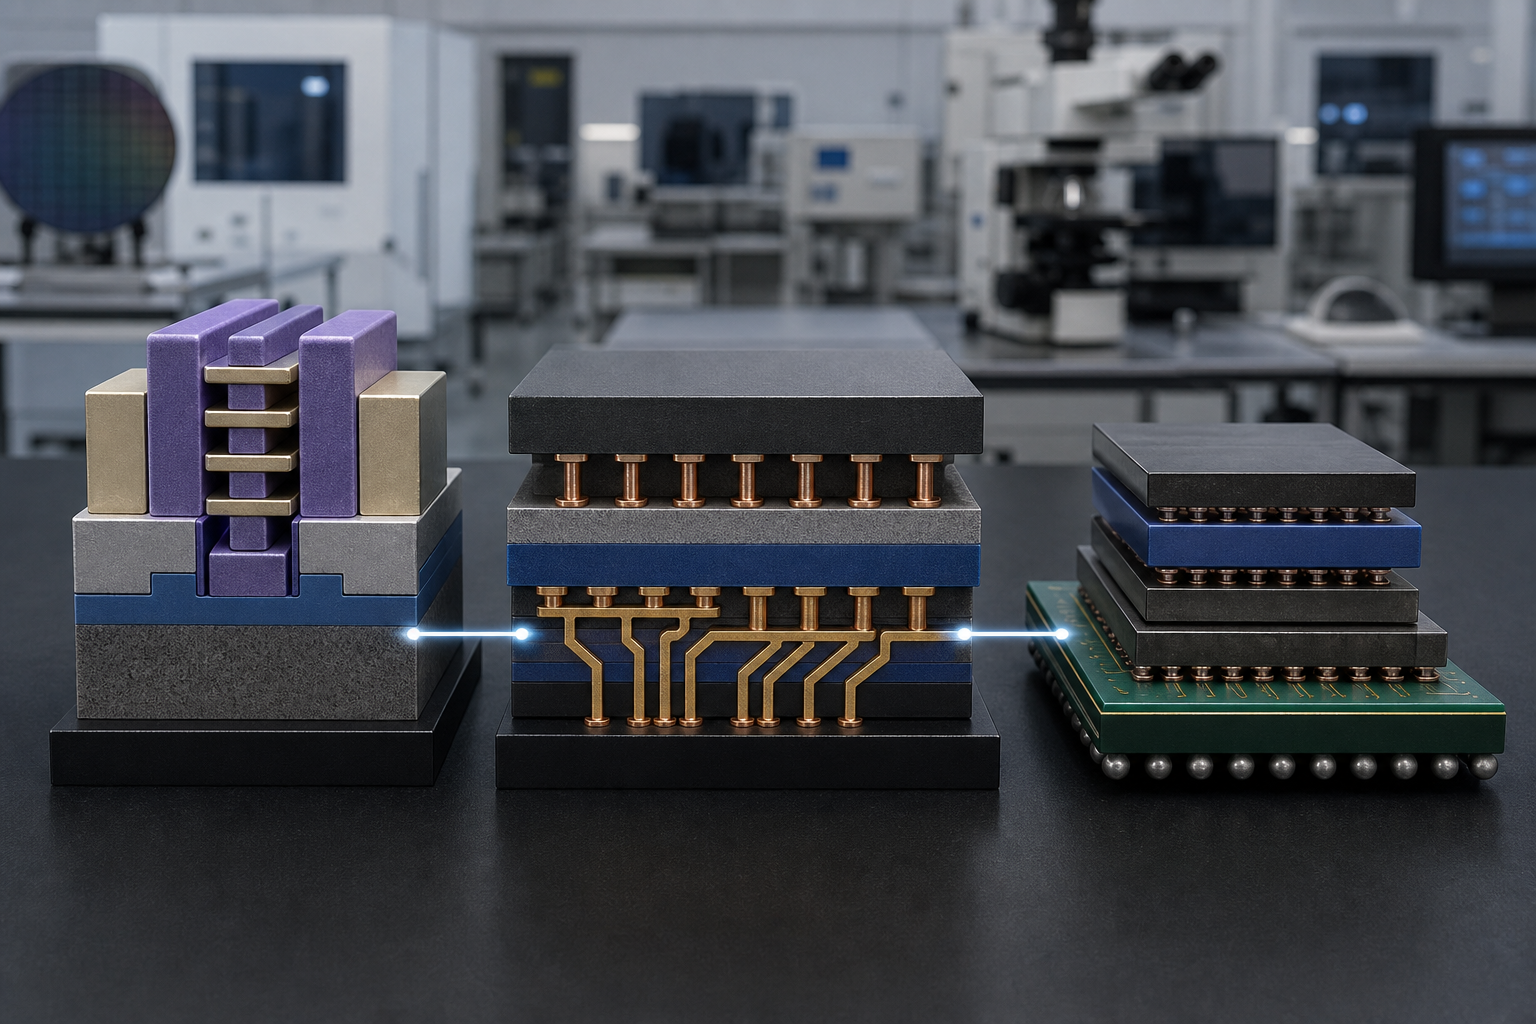
Physical models connect a RibbonFET transistor, backside power delivery, and stacked chiplets from left to right to explain Intel 18A

<Reconstructed explanatory image of the Intel 18A RibbonFET, PowerVia, and Foveros relationship 2.1>

Intel's official 18A explanation states targets of up to 15% better performance per watt and 30% higher chip density than Intel 3. These are company process claims, so performance, power, and manufacturing cost in an actual notebook or server still need to be tested by design, yield, package, and memory configuration. A process name does not automatically guarantee a superior finished product.

The first symbolic product is Core Ultra Series 3, code-named Panther Lake. In this Panther Lake AI PC, Intel lists up to 16 performance and efficiency cores, an Arc GPU with up to 12 Xe cores, and up to 180 platform TOPS, with broad availability beginning in January 2026. Intel Pro Day 2026 described more than 125 designs spanning enterprises, education, government, and small and medium businesses. The meaning of an AI PC depends less on the TOPS number than on whether meeting summaries, security, and content-creation workloads become repeat uses within battery and privacy constraints.

In servers, Xeon 6+ Clearwater Forest extends the 18A validation. Intel lists up to 288 efficiency cores and a 17% instructions-per-cycle improvement from the previous generation, targeting processing density and energy cost for cloud providers and telecom operators. Stable client and server shipments on the same process would become evidence of yield and schedule discipline for outside customers. Delays or cost problems would damage product and Foundry credibility at the same time.

The competitive field is broad. Apple, AMD, and Qualcomm pressure PCs through power efficiency and on-device AI. AMD EPYC and custom Arm CPUs compete for data-center share. TSMC and Samsung Foundry compete in manufacturing. TSMC A16 also makes backside power delivery central to its proposition, so Intel must prove differentiation through customer designs, yield, delivery, and total cost rather than technology announcements alone.

Q1 2026 growth is encouraging, but Foundry economics remain unproven

In Intel's official Q1 2026 results, revenue was $13.6 billion, up 7% year over year. CCG revenue rose 1% to $7.7 billion, while DCAI rose 22% to $5.1 billion. Total Intel Products revenue was $12.8 billion, and Intel Foundry segment revenue, including intersegment transactions, increased 16% to $5.4 billion. Operating cash flow for the quarter was $1.1 billion.

Official Q1 2026 metric Result What it means
Consolidated revenue $13.6 billion 7% year-over-year growth
CCG revenue $7.7 billion Up 1%; the PC recovery remains gradual
DCAI revenue $5.1 billion Up 22%; servers are the growth engine
GAAP gross margin 39.4% Improved 2.5 percentage points year over year
GAAP net loss $3.7 billion Includes restructuring and other items; profitability is not restored
Non-GAAP net income $1.5 billion The gap between adjusted and reported results matters
Q2 revenue outlook $13.8–14.8 billion Company guidance, not a completed result

The GAAP operating loss was 23.1% of revenue and the net loss was $3.7 billion, while the non-GAAP operating margin was 12.3% and non-GAAP net income was $1.5 billion. The large gap reflects restructuring, investment and equity remeasurement, and other adjustments. Looking only at non-GAAP results can conceal real costs, while treating one GAAP quarter as the whole operating trend can miss improvement. Cash flow and segment economics belong beside both measures.

The annual Foundry figures are more sobering. Intel Foundry generated $17.826 billion in 2025 revenue but incurred $28.144 billion in cost of sales and operating expenses, producing a $10.318 billion operating loss. That improved from a $13.291 billion loss in 2024, yet Intel also recorded $849 million of 2025 intersegment inventory reserves related to products made during the early Intel 18A ramp. Until yield gains and external customer growth appear in financial results, Foundry is both a strategic option and a major capital burden.

Intel Foundry revenue includes substantial transactions with Intel Products. Q1 2026 Foundry revenue of $5.4 billion should not be read as independent external foundry sales, and the 2025 figure of $17.826 billion is not directly comparable with TSMC-style external revenue.

Final assessment includes execution, customer, AI, and capital risk

The first risk is process execution. An advanced node requires design rules, equipment, materials, yield, and packaging to work together. Even after initial shipments, low yield can disrupt cost and supply. Intel must demonstrate repeatability through Panther Lake volumes, Clearwater Forest delivery, external customer tape-outs, and repeat orders.

The second risk is customer conflict. Foundry customers want their chip designs and launch schedules isolated from competing Intel Products organizations. They need access controls, fair pricing, credible capacity priorities, and confidence in the long-term roadmap. The internal products that fill factories can become a perceived conflict of interest for an outside customer.

The third is AI positioning. Intel has a credible argument that the CPU remains an essential general-compute layer in every AI system, but developer attention and accelerator budgets are concentrated around NVIDIA and competitors. In the AI semiconductor market, Intel's realistic contest is not one GPU alone. It is a package of Xeon, AI PCs, networking, packaging, and customer-chip manufacturing. A bundled strategy works only when every important component is competitive enough.

The fourth is capital and policy. Leading-edge U.S. manufacturing can provide supply-chain resilience and public-policy support, but factory construction, depreciation, and utilization are expensive. If demand arrives late or customer wins are insufficient, a strategic asset becomes fixed cost. If geopolitical supply-chain restructuring accelerates, the ability to offer design, manufacturing, and packaging in the United States could instead become a differentiator.

Intel is therefore neither merely an old PC CPU company nor an already completed global foundry. Q1 2026 revenue growth of 7% and DCAI growth of 22% show that the product base remains alive. The $10.318 billion 2025 Foundry operating loss and small external revenue show how far the transition still has to travel. The indicators to watch are 18A product yield and shipment volume, external Foundry revenue and customer count, CCG share, DCAI growth, gross margin, and cash flow relative to capital spending. If those measures improve together, Intel's integration of design and manufacturing can become a competitive advantage again rather than a burden.

Monday, August 3, 2026

Meta Company Review — From Advertising to Personal AI

Meta began as the Facebook company, but its economic substance today is an advertising platform operating several social graphs and recommendation systems. Facebook, Instagram, Messenger, WhatsApp, and Threads collect different relationships and content, while machine learning selects the posts and advertisements people see. Meta's core product was a massive prediction system before generative AI arrived. The company is now extending that system into conversational Meta AI, creation tools, and glasses.

This Meta company review looks beyond model announcements. It examines how founder and CEO Mark Zuckerberg uses advertising cash flow to fund data centers, Muse Spark, AI glasses, and Reality Labs. It asks whether distribution to more than 3.5 billion daily users can become an AI-platform advantage and weighs that opportunity against immense capital spending, privacy, content safety, and hardware losses. The latest detailed financial baseline is Meta's official first quarter ended March 31, 2026.

Original official Meta corporate logo distributed by Meta Newsroom

<Official Meta corporate logo 1.1>

The Meta AI platform begins with social distribution and advertising learning

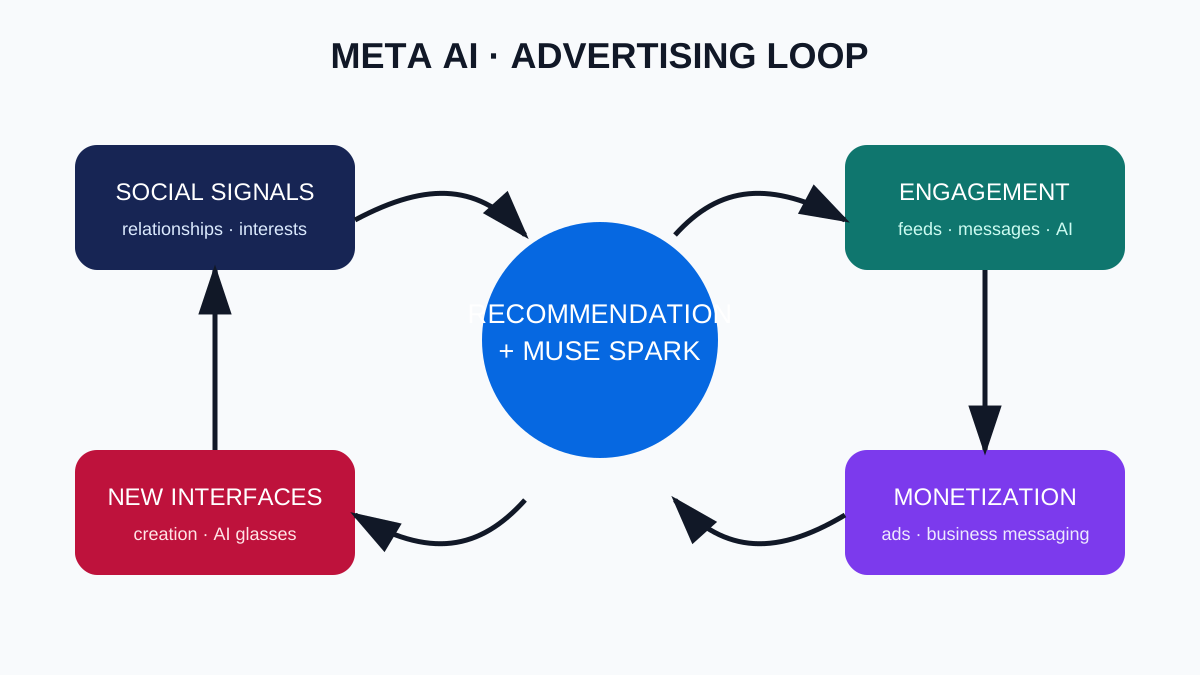
The strongest asset of the Meta advertising business and its AI transition is not the number of apps but its scale of relationship, interest, and behavior signals. Instagram captures creators and interests; Facebook maps friends, groups, and local relationships; WhatsApp and Messenger hold conversations; Threads carries public discussion. Recommendation models use these signals to order feeds and Reels and estimate conversion probability. Better recommendations increase attention and advertising opportunities, while additional reactions improve the models again.

Generative AI adds three functions to this loop. Users can ask, search, and create without leaving an app. Creators can increase supply through text, image, and video tools. Advertisers can automate creative production and targeting. According to the official Muse Spark announcement, the model starts in the Meta AI app and website and extends across WhatsApp, Instagram, Facebook, Messenger, Threads, and AI glasses. The strategy embeds a model inside existing behavior rather than centering on a standalone API.

Layer Representative assets User and customer value Meta's economics
Relationships and content Facebook, Instagram, Threads Discover people, interests, creators Engagement and proprietary signals
Messaging WhatsApp, Messenger Personal, group, and business conversation Business messaging and payment options
Intelligence Recommendation, Muse Spark, Meta AI Search, conversation, creation, action Engagement, ad efficiency, new touchpoints
Advertising Advantage+ and measurement Customer discovery and automation Core revenue and cash flow
Hardware Meta Glasses, Quest Hands-free visual and voice access Next interface with high investment cost

The structure resembles the Google AI platform, but the data and monetization differ. Google begins with search intent and Cloud consumption; Meta begins with relationship- and interest-driven feeds and ad auctions. Microsoft attaches AI to work documents and development tools, while Meta treats the frequency of daily conversation, creation, and discovery as its advantage. For each company, the moat is less the model itself than its combination with distribution, data, and advertising or subscription economics.

Meta loop in which social signals feed recommendations and Muse Spark, then engagement, advertising, creation, and AI glasses

<Meta AI and advertising flywheel 1.2>

Muse Spark and AI glasses target the interface after the smartphone

Meta has long faced the risk of not controlling mobile operating systems. Apple's privacy-policy changes showed how one outside platform rule can materially affect advertising measurement. Meta's investment in Quest and glasses is not simply a bid for hardware sales. If AI on a wearable device can understand what a user sees and hears through cameras and microphones, Meta may own an interaction point in front of smartphone applications.

The official Meta Glasses announcement says Muse Spark powers Meta AI in the glasses from launch in the United States and Canada, with visual understanding, calendar help, pedestrian navigation, and live translation. Glasses let people ask, capture, and listen without taking out a phone. Response speed, battery life, camera privacy, and social acceptance therefore determine the product together.

The Muse Spark model is the first result from the AI stack rebuilt by Meta Superintelligence Labs. Meta chose a small, fast model for reasoning and multimodal work inside products, with larger successors planned. Serving billions of people across applications and glasses makes inference cost, latency, safety filters, local languages, and recommendation provenance as important as the best benchmark. The more powerful personalization becomes, the more clearly users must understand and control which data was used and why.

Meta's open-model history expanded its developer ecosystem, but the 2026 strategy is more mixed. Muse Spark is available through a private API preview to selected partners, and Meta says it hopes to open-source future models. Openness increases external innovation and standards influence, but competitors can use the technology and safety and licensing obligations remain. Closure preserves product differentiation, but it can weaken the broad developer trust created by Llama.

Q1 2026 shows both advertising power and AI capital intensity

In Meta's official Q1 2026 results, revenue rose 33% year over year to $56.31 billion, operating income reached $22.87 billion, and operating margin was 41%. Net income, including a one-time tax benefit, was $26.77 billion. Ad impressions increased 19%, while average price per ad rose 12%. Usage and monetization improved together.

Official Q1 2026 metric Result Interpretation
Revenue $56.31 billion 33% year-over-year growth
Operating income and margin $22.87 billion and 41% Strong profitability during AI investment
Family daily active people 3.56 billion Distribution grew 4% year over year
Ad impressions and average price Up 19% and 12% Engagement and demand expanded together
Quarterly capital expenditures $19.84 billion Data-center and server investment accelerated
2026 capital-expenditure outlook $125–145 billion AI capacity and component costs reflected

Family of Apps generated $55.91 billion of revenue and $26.90 billion of operating income. Reality Labs produced only $402 million of revenue and lost $4.03 billion from operations. The advertising apps clearly finance hardware and long-duration research. Even if glasses grow, hardware with components, distribution, and returns is unlikely to achieve the economics of advertising software.

The spending outlook marks a larger change. Meta expects $125 billion to $145 billion of 2026 capital expenditures. Advertising recommendations, generative models, and AI assistants all require accelerators, networking, power, and data centers in advance. Infrastructure becomes a competitive advantage if demand arrives as planned; if model efficiency improves faster than demand or monetization is late, depreciation and power contracts pressure profit. The relationship with the NVIDIA AI factory is similarly double-sided: strategic supplier and central cost structure.

Meta's Q1 net income and EPS include an $8.03 billion one-time tax benefit. Operating performance is better judged through 33% revenue growth and a 41% operating margin; the tax effect should not be treated as recurring earnings.

Final assessment across privacy, content, and investment discipline

Privacy and regulation are the first risk. As a personal AI uses messages, location, visual input, and interests, usefulness and surveillance concerns rise together. Consent, purpose limitation, protection of minors, political advertising, cross-border transfers, and competition law can constrain product design. Compliance is not merely legal overhead. It changes the context a model may access and the accuracy of advertising measurement.

Content quality is the second risk. Generative tools can increase useful creative supply and low-cost spam, scams, impersonation, and synthetic content at the same time. Optimizing only short-term engagement can erode trust and make advertisers fear for brand safety. Provenance, watermarking, impersonation defenses, creator compensation, and recommendation transparency are conditions of platform economics, not optional additions to AI features.

Founder control and investment discipline form the third risk. Mark Zuckerberg's voting control supports long-duration spending, but outside shareholders have limited ability to redirect Reality Labs and hyperscale AI investment. If the vision is right, Meta can build a new platform without quarterly pressure. If it is wrong, losses can persist. The board and management should explain returns through AI revenue, advertising lift, device retention, and unit inference cost rather than user scale alone.

Competition is the fourth risk. TikTok and YouTube compete for video attention; Apple and Google control mobile gateways; OpenAI, Google, and Anthropic seek the AI-assistant relationship. Messaging economics vary by region and regulation, while glasses require excellent hardware and fashion-partner execution. Meta's social graph is formidable, but an old relationship advantage does not automatically transfer to a new interface.

Meta is a platform that uses advertising profits to construct AI infrastructure, uses that AI to improve recommendations, advertising, and creation, and then attempts to establish Meta AI and glasses as new touchpoints. Q1 2026 revenue growth of 33% and a 41% operating margin demonstrate financial capacity, while $125–145 billion in planned annual capex and Reality Labs losses reveal the scale of expectations. Durable indicators extend beyond Family user counts: repeat Muse Spark use and cost, real advertiser conversion lift, WhatsApp business monetization, AI-glasses retention, trust in generated content, data-center returns, and regulatory execution will decide whether Meta becomes a personal AI platform.

Apple Company Review — Devices, Services, and Private AI

Calling Apple an iPhone manufacturer identifies its largest source of revenue, but it does not fully explain how the company competes. Apple combines chips, operating systems, devices, app distribution, payments, subscription services, and physical stores into one experience. From the moment a customer activates a new device, identity, photos, messages, health data, and purchases begin to connect, while developers reach that customer through a shared toolchain and distribution network. The integration creates convenience and security, but it also raises switching costs and platform power.

This Apple company review focuses on the economics of Apple vertical integration rather than a product-specification contest. It examines how the hardware-software model established by Steve Jobs is being extended under CEO John Ternus through Apple silicon, Services, and the Apple Intelligence strategy. It also asks whether formidable cash generation can absorb AI execution delays, regulation, and China supply-chain risk. Financial analysis uses Apple's official fiscal second quarter ended March 28, 2026.

Apple's trademark guidelines expressly prohibit an unlicensed third-party publication from using the Apple logo or Apple-owned graphic icons. This independent review therefore does not reproduce the logo and is not authorized, sponsored, or approved by Apple.

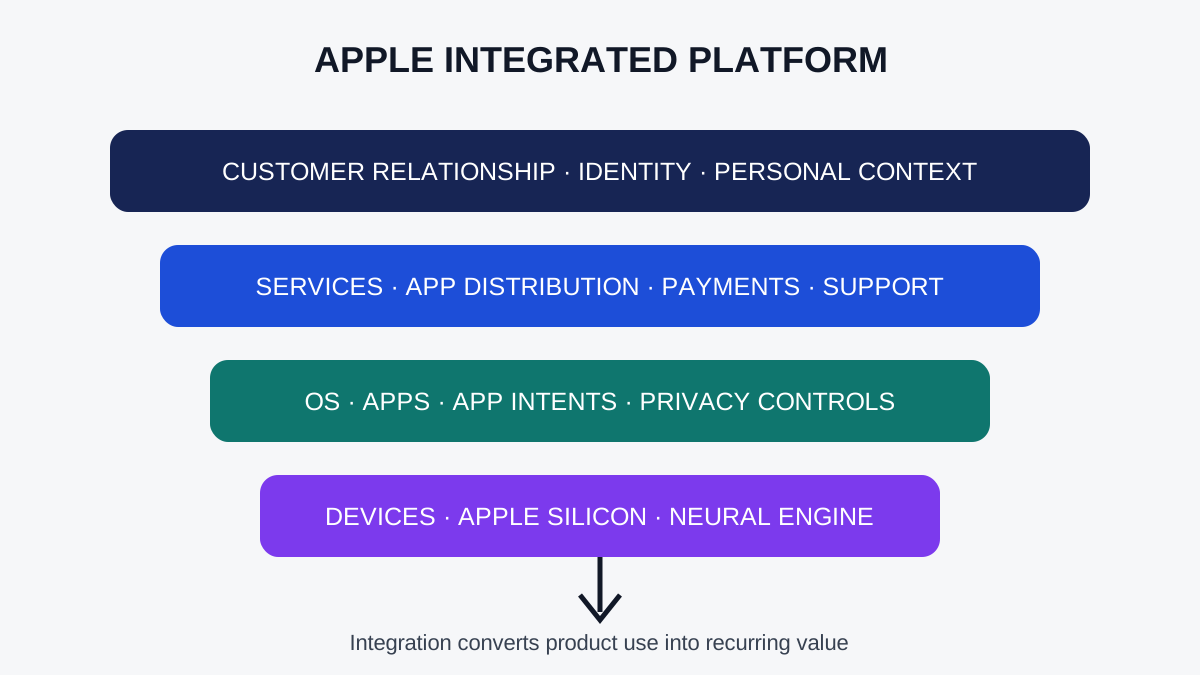
Diagram connecting Apple devices with on-device models, Private Cloud Compute, services, and the customer relationship

<Apple Intelligence integration architecture 1.1>

Apple vertical integration turns device sales into customer relationships

Apple began in personal computers, but the key economic unit today is not one device. It is the relationship between a user and a set of devices. The iPhone is the center for cameras, communications, and authentication. Macs and iPads expand the work surface, while the Watch and AirPods add health, notification, and voice touchpoints. iCloud synchronizes data, the App Store supplies software, and AppleCare, Music, TV, and payment services add recurring revenue. Satisfaction with one product increases the probability of choosing the next.

Apple silicon is the technical foundation of this integration. Co-designing CPUs, GPUs, the Neural Engine, media engines, and memory around operating-system requirements allows Apple to tune battery life, heat, camera processing, and machine-learning features more precisely than a generic collection of components. As our Apple M-series analysis explained, performance per watt is not merely a benchmark advantage. It enables thinner devices, longer battery life, and a common development framework.

Integrated layer Representative assets Customer value Apple's economics
Silicon A and M series, Neural Engine Performance, battery, security Component differentiation and cost control
Operating systems iOS, macOS, watchOS, visionOS Continuity and consistent permissions Feature distribution and switching cost
Devices iPhone, Mac, iPad, Watch, AirPods More personal-computing touchpoints Premium hardware revenue
Distribution and services App Store, iCloud, AppleCare, media Simpler purchasing, backup, subscriptions Recurring revenue and high gross margin
Intelligence Apple Intelligence, Siri AI, PCC Personal context with privacy Upgrades and service retention

Services cushions hardware cycles. As the installed base expands, storage, warranties, app commissions, search placement, and media subscriptions generate revenue even when new iPhone sales slow. Yet access to those services remains coupled to Apple devices. A customer facing the transfer of several devices and years of data may reject a cheaper competing product because migration is expensive. A convenient ecosystem and lock-in are two sides of the same design.

The Apple Intelligence strategy tests privacy and model competitiveness together

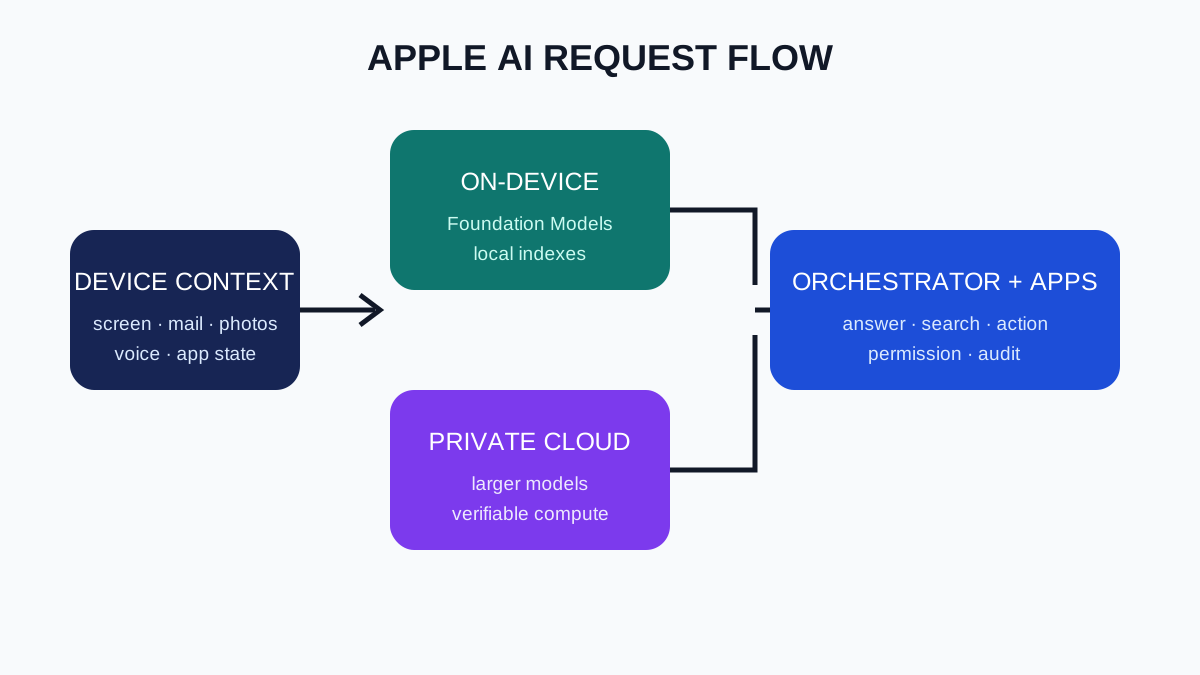
Apple's 2026 Siri AI announcement describes three broad layers. Smaller tasks use Foundation Models, the Spotlight index, and App Toolbox on the device. Requests needing larger models go to Private Cloud Compute. When a task needs current information or broad knowledge, a system orchestrator selects the relevant capability. For an assistant working across personal messages, email, and photos, data minimization and execution permissions matter as much as a model score.

Apple Machine Learning Research says the third generation of Apple Foundation Models contains two on-device models and server models for Private Cloud Compute. AFM 3 Core is a dense model of roughly three billion parameters, while Core Advanced adds stronger multimodal capabilities. Apple's disclosure that it built the model family in collaboration with Google is pragmatic. Apple does not need to monopolize every piece of foundation research if it can differentiate through devices, operating systems, personal context, and a secure execution layer.

Apple AI request flow from device context through local processing or Private Cloud Compute and back to app actions

<Apple AI request-processing flow 2.1>

The design has three advantages. First, handling frequent tasks on a device can reduce latency and server cost. Second, Apple-controlled hardware security and verifiable server images provide a stronger privacy case for sensitive personal context. Third, if App Intents and system frameworks mature, developers can expose useful actions without rebuilding an entire application around a new AI interface.

Execution risk is equally substantial. An AI assistant must work outside demos across languages, old data, ambiguous contacts, and incorrect screen states. Apple already paid a credibility cost for delayed Siri capabilities, and the 2026 architecture still must pass developer testing and beta use. On-device models face memory and power constraints; server models increase data-center investment and reliance on outside model expertise. A stronger privacy promise also raises the standard for error explanations, auditability, and security verification.

The economics differ from the Google AI platform and the Microsoft AI platform. Google and Microsoft directly sell model consumption through cloud APIs and enterprise software. Apple has more indirect economics: intelligence should improve device replacement demand, satisfaction, app use, and service retention. Supported-device reach, task-completion rates, developer adoption, and customer retention therefore matter more than a model leaderboard alone.

Q2 FY2026 shows both a powerful cash engine and concentration risk

In Apple's official Q2 FY2026 release, revenue reached $111.2 billion, up 17% year over year, while diluted earnings per share rose 22% to $2.01. Apple said total revenue, iPhone revenue, and EPS set March-quarter records, while Services reached an all-time revenue high. Those results support management's argument that the hardware installed base and recurring services can grow together.

Official Q2 FY2026 metric Result What it means
Revenue $111.2 billion 17% year-over-year growth
Diluted EPS $2.01 22% year-over-year growth
First-half operating cash flow $95.3 billion Large capacity for investment and returns
First-half share repurchases $48.6 billion Capital returns and a lower share count
Cash and equivalents at March 2026 $45.6 billion Capacity to absorb supply and regulatory shocks

The official consolidated statements show roughly $95.3 billion of operating cash flow during the first half of fiscal 2026 and about $5.2 billion of property, plant, and equipment purchases. Apple spent approximately $48.6 billion on share repurchases during the same period. Apple generates extraordinary cash with less owned physical infrastructure than a hyperscale cloud provider because manufacturing is largely delegated to supply-chain partners while design, software, brand, and distribution capture the value.

That asset-light structure does not eliminate operational risk. Advanced fabrication depends heavily on TSMC, while memory, displays, and assembly rely on a limited group of suppliers and Asian production networks. Forecast errors, tariffs, export controls, or geopolitical disruption can affect component availability, price, and launch timing simultaneously. Custom-chip design does not become a product without manufacturing partners executing the process roadmap.

Revenue concentration also matters. Services is growing, but the iPhone remains the main gateway into the ecosystem and its cash flow. Longer smartphone replacement cycles, stronger Chinese premium brands, or AI capabilities that fail to motivate upgrades could slow hardware and services together. The installed base is a moat; it does not completely isolate the company if the central entry point weakens.

Final assessment across regulation, supply chains, and AI execution

Platform regulation is the first risk. App Store commissions and payment rules, default applications, browser engines, and data access face competition-policy scrutiny in the United States, Europe, and elsewhere. Wider outside payments and alternative distribution may reduce commissions while making security accountability more complicated. Excessively closed controls can also limit developer innovation and consumer choice. Apple must show that security benefits correspond to concrete threat models and proportionate rules.

Leadership transition is the second risk. Tim Cook made Apple one of the world's strongest cash generators through supply-chain execution and Services expansion before moving to executive chairman in 2026. CEO John Ternus must preserve that efficiency while redesigning interfaces, form factors, and developer relationships for the AI era. Maintaining an existing operating system and discovering the next computing touchpoint require different skills.

Capturing generative-AI value is the third risk. If models become commodities, Apple can select among providers and integrate them into device experiences. If an AI assistant becomes a more important user gateway than the operating system, outside model companies may own the relationship. Apple's defense is not exclusive ownership of one model. It is the ability to use personal context safely, complete actions in apps, and work consistently across devices.

Apple is not simply a company that assembles components. It is a platform that controls layers from silicon to services in order to design customer experience and economics together. Q2 FY2026 revenue of $111.2 billion and a Services record show that the structure remains powerful. Its durable indicators extend beyond iPhone unit sales: Apple Intelligence task completion, supported devices and languages, the quality of Apple Services growth, sustainable developer rules, resilience in China and the supply chain, and whether the post-transition leadership can add a new product category to the installed base.

Sunday, August 2, 2026

Amazon Company Review — AWS's Vertical AI Infrastructure Stack

Amazon is an unusual combination of online retailer, logistics operator, cloud provider, advertising platform, and AI company inside one corporation. Consumers see product search and Prime delivery, while AWS supplies a crucial share of enterprise value. A more complete description is that Amazon predicts demand with software, operates warehouses and delivery networks in the physical world, and sells the computing capabilities developed through that process to outside organizations. In the generative-AI era, those capabilities are expanding into Trainium chips, the Bedrock model layer, and agent operations.

This Amazon company review does not isolate e-commerce revenue from AWS. It asks how Jeff Bezos's long-term investment principle became delivery speed, custom silicon, data centers, and advertising under Andy Jassy, and why rapid AWS AI infrastructure growth creates both a moat and a heavy cash burden. Financial figures follow the official second quarter of 2026, ended June 30.

Official AWS logo provided by Amazon Press Center

<Official AWS product logo 1.1>

One operating system from retail to AWS AI infrastructure

Amazon's first advantage is not sheer size but a repeatable operating system. Software links listings, payments, recommendations, inventory placement, warehouse automation, last-mile delivery, and service. Sellers using Marketplace and Fulfillment by Amazon increase selection and logistics density. Prime members purchase more frequently, and advertisers reach people near a transaction. Lower unit costs and faster delivery reinforce demand.

AWS emerged as Amazon standardized internal infrastructure problems. Instead of preparing servers again for each project, it exposed computing, storage, and databases through APIs, allowing customers to trade initial capital spending for usage charges. AWS now competes as more than EC2. Regions, networking, storage, databases, Kubernetes, serverless computing, security, analytics, and AI appear on one operating surface.

Layer Representative products Customer value Amazon economics
Physical foundation Regions, data centers, networks, S3 Capacity, durability, global placement Scale and long-lived assets
Compute EC2, Graviton, Trainium, GPUs Choice for general and AI workloads Supply and cost control through silicon
Platform EKS, Lambda, SageMaker, OpenSearch Development and operations automation More usage and switching costs
Models and agents Bedrock, AgentCore, Kiro, Quick Multi-model access, permissions, action Higher-value AI consumption
Consumer and industry Stores, Ads, Alexa, logistics, Leo Transactions and physical delivery Data and distribution outside Cloud

The official Amazon Bedrock documentation emphasizes managed access to multiple leading models with security and governance, rather than one proprietary model. Customers can change providers or divide tasks by model while retaining AWS identity, networking, logs, and data. AWS does not need to own the best foundation model if it owns a valuable selection gateway and operating foundation.

That position makes the NVIDIA AI factory both partner and competitor. AWS offers NVIDIA GPUs at scale while using Trainium and Inferentia to bring some training and inference economics onto internal silicon. Customers receive choice; AWS gains differentiation and negotiating leverage. Mature CUDA software and migration cost mean that price-performance claims alone do not guarantee custom-chip adoption.

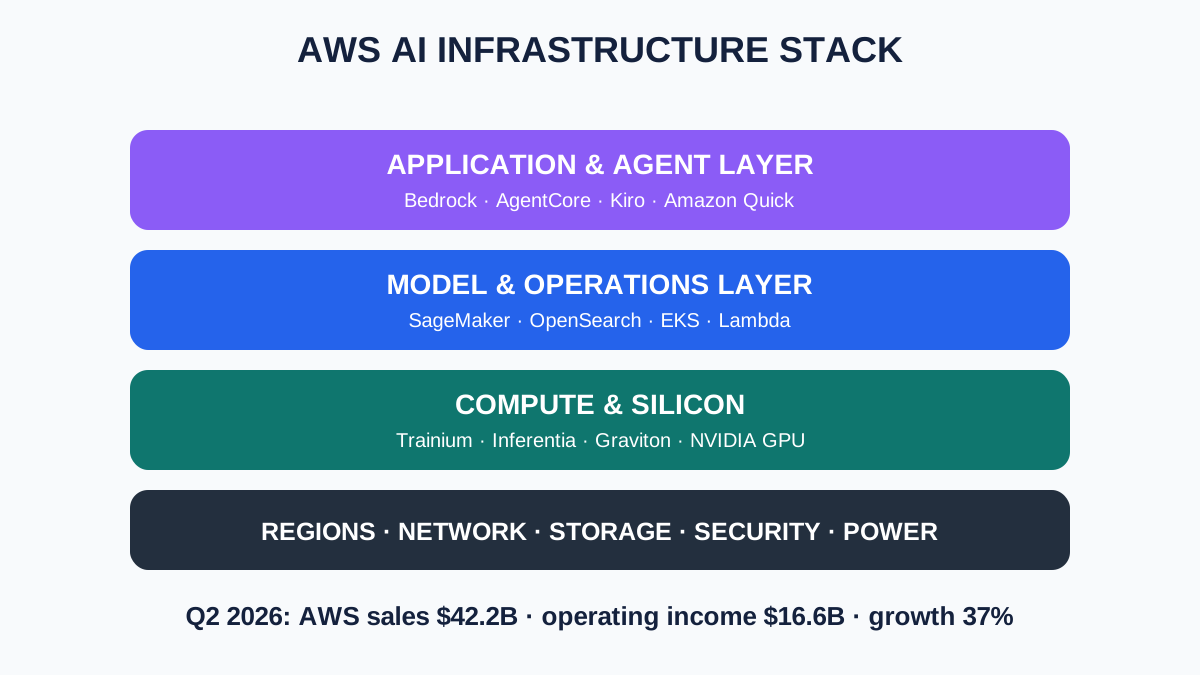
AWS region, silicon, model operations and agent layers with Q2 2026 results

<AWS vertical AI infrastructure stack 1.2>

Andy Jassy's platform strategy and the Q2 2026 numbers

Jeff Bezos's emphasis on long horizons and customer obsession created a culture willing to build infrastructure ahead of immediate profit. Andy Jassy, who led AWS before becoming chief executive, has combined that principle with a stronger focus on operating efficiency. Amazon adjusted excess logistics capacity after the pandemic and improved regional inventory placement while investing aggressively again in AI data centers. It is cutting unit cost in one system while adding assets for expected demand in another.

According to Amazon's official Q2 2026 results, net sales grew 20% to $200.6 billion and operating income rose 43% to $27.5 billion. North America generated $116.2 billion of sales, International $42.2 billion, and AWS $42.2 billion. AWS grew 37%, its fastest rate in 18 quarters, and produced $16.6 billion of operating income—about 60% of Amazon's consolidated operating income.

Q2 2026 metric Result Interpretation
Net sales $200.6 billion 20% year-over-year growth
Operating income $27.5 billion 43% year-over-year growth
AWS sales $42.2 billion 37% year-over-year growth
AWS operating income $16.6 billion About 60% of total operating income
Trailing-12-month free cash flow $7.6 billion outflow Reversed from $18.2 billion inflow as AI investment rose

Net income of $62.6 billion should not be treated as ordinary operating performance. It included $53.4 billion of pre-tax other income, primarily related to Amazon's Anthropic investment. Operating income and cash flow better isolate the core businesses. Trailing-12-month operating cash flow rose 33% to $161.4 billion, yet free cash flow turned into a $7.6 billion outflow. Amazon attributed a $66.1 billion year-over-year increase in net property and equipment purchases primarily to AI investment.

AWS's profit contribution explains why Amazon directs more capital toward data centers. It also creates a timing gap: equipment consumes cash first, while contracted usage becomes revenue over years. If AI demand expands as forecast, construction becomes a moat. If customer optimization or model efficiency reduces capacity needs, depreciation and power commitments weigh on returns.

The Trainium, Bedrock, and Anthropic vertical stack

The Trainium ecosystem centers on AWS's accelerator for training and large-scale inference; Inferentia focuses on inference economics. The Neuron SDK connects these chips to tools such as PyTorch, Hugging Face, and vLLM. The official release said both AWS's AI business and chips business exceeded $25 billion annual revenue run rates and were growing at triple-digit percentages. Multi-year, multi-gigawatt Trainium commitments from Anthropic and OpenAI suggest the chip has moved beyond internal experimentation into the supply strategy of major model builders.

Graviton provides an earlier example of the same approach. Amazon designs general-purpose Arm CPUs to improve EC2 price-performance and diversify supply. It said Graviton5 delivers up to 25% more compute performance than Graviton4 and that 98% of the top 1,000 EC2 customers use Graviton. The Arm CPU IP platform lets a cloud operator preserve a standard instruction ecosystem while differentiating hardware.

Bedrock is the model market above the chips. AWS said it added more than ten managed foundation models during Q2, including offerings from OpenAI, Anthropic, and Google DeepMind, and that hundreds of thousands of customers use Bedrock. AgentCore supplies runtime, permissions, payments, search, and observability for agents. SageMaker, OpenSearch, and Lambda cover training, data, and execution. Consumption can spread through multiple AWS services from the accelerator to the agent.

AWS's AI moat is less the intelligence of one model than the ability to provide regions, power, networking, custom chips, multi-model APIs, and enterprise operations together. The deeper the integration, the more customers must weigh convenience against lock-in.

The Anthropic relationship is strategically important and financially complicated. Amazon gains from investment appreciation, while AWS is Anthropic's large computing provider and Bedrock distributor. The relationship can accelerate Trainium's ecosystem, but it also raises questions about economic concentration, conflicts, and equal treatment within a nominally multi-model platform.

Capital, concentration, regulation, and the final assessment

Capital and power are the first risk. An AI data center needs more than chips: grid connections, cooling, fiber, land, permits, and long purchase commitments are necessary. AWS AI Factories, which place dedicated environments at customer facilities, address sovereignty requirements but add project complexity and lengthen asset payback. The free-cash-flow outflow is the clearest indicator of this transition.

Competition and customer concentration are second. Microsoft Azure and Google Cloud combine models, workplace software, and custom chips. Large AI labs bring substantial revenue but also negotiating leverage and capacity-commitment risk. As customers combine clouds with their own facilities, workload retention matters more than a headline market-share estimate.

Reliability and security are third. An AWS failure can interrupt thousands of companies, while agents that make payments and infrastructure changes increase the damage from excessive permissions or prompt attacks. Region isolation, least privilege, audit, and recovery architecture matter more than the length of a product catalog. A managed layer does not remove the customer's design responsibility.

Regulation and labor form the fourth risk. Marketplace fees, Amazon's relationship with third-party sellers, advertising placement, logistics labor, and data use are separate regulatory surfaces. As AI automates recommendations, pricing, warehouses, and service, Amazon inherits responsibilities for discrimination, explainability, and workforce transition alongside efficiency gains.

Amazon transferred operating lessons from commerce and logistics into Cloud and is now extending AWS into a vertical AI stack of chips, models, and agents. Q2 2026 AWS sales of $42.2 billion, growth of 37%, and operating income of $16.6 billion demonstrate the strategy's strength. The trailing free-cash-flow outflow of $7.6 billion demonstrates that growth is not free. Durable indicators include diversification of external Trainium customers, recurring Bedrock usage, power and facility utilization, cash-flow recovery, Anthropic concentration, reliability and security, and whether the interaction among retail, advertising, and Cloud creates real customer value.

Alphabet Company Review — Google's Full-Stack AI Flywheel

Calling Alphabet a search-advertising company identifies its current cash engine, but it does not fully explain where the company is spending money or what it is trying to defend. Google Search and YouTube are enormous distribution networks. Gemini is the model layer entering that distribution. Google Cloud is the business through which outside companies buy access to related models, data, security, and operations. TPUs and Google's global network sit beneath those layers, giving the company some control over cost and supply. Alphabet's defining feature is the way these seemingly separate assets reinforce one another.

This Alphabet company review connects technology and business economics rather than forecasting the stock. It asks why the search company founded by Larry Page and Sergey Brin is investing simultaneously in custom chips, models, cloud infrastructure, and agents under Sundar Pichai, and whether that investment widens the advertising moat or primarily raises capital intensity. Financial and usage figures follow the company's official Q2 2026 remarks published on July 22, 2026.

Official Google Cloud product icon

<Official Google Cloud product icon 1.1>

From search distribution to a full-stack Google AI platform

Google began by connecting user questions to web documents. Advertising beside search results matches marketers with moments of relatively clear intent, while massive traffic enables measurement and experimentation. YouTube extends discovery into video and combines advertising with subscriptions. Android and Chrome provide access points; Maps, Gmail, and Workspace extend Google into daily and professional activity. This distribution lets the company test a new AI feature with hundreds of millions of people unusually quickly.

Generative AI strengthens and destabilizes that structure at the same time. If an AI answer replaces a results page, traditional links and ad formats may weaken, and a long generated response costs much more to compute than an old-style query. If people ask more difficult questions more frequently, however, Google receives more opportunities to understand intent and connect services. Integrating AI Overviews and AI Mode into one Search experience reflects the need to defend the existing engine while learning the economics of the new interface.

Layer Representative assets Business role Central tension
Consumer distribution Search, YouTube, Android, Chrome Users and advertising demand AI answers versus the open web
Models Gemini, Gemma, DeepMind research Reasoning, multimodality, agents Training cost, inference cost, safety
Enterprise platform Google Cloud, Vertex AI, Workspace Usage, seats, long contracts Competition with AWS and Microsoft
Infrastructure TPUs, GPUs, data centers, network Performance, supply, unit cost Power, depreciation, capital spending
Long-duration options Waymo and Other Bets Entry into new markets Persistent operating losses

The Gemini ecosystem is not one chatbot. The same model family appears in the consumer app, Search, Workspace, developer APIs, and Google Cloud enterprise products. Open Gemma models create a connection with local and research ecosystems. Vertex AI and Gemini Enterprise combine enterprise data, evaluation, permissions, cost controls, and agent deployment. The strategy assumes that a company with distribution and operations can get closer to real work than a model vendor selling intelligence alone.

This position invites a direct comparison with the Microsoft AI platform. Microsoft connects Azure, Microsoft 365, and GitHub to enterprise workflows. Google combines consumer distribution through Search and YouTube with Workspace, analytics, and custom TPUs. Both are trying to turn data, identity, delivery, and cost control into platform value beyond the model, but they begin from different customer relationships.

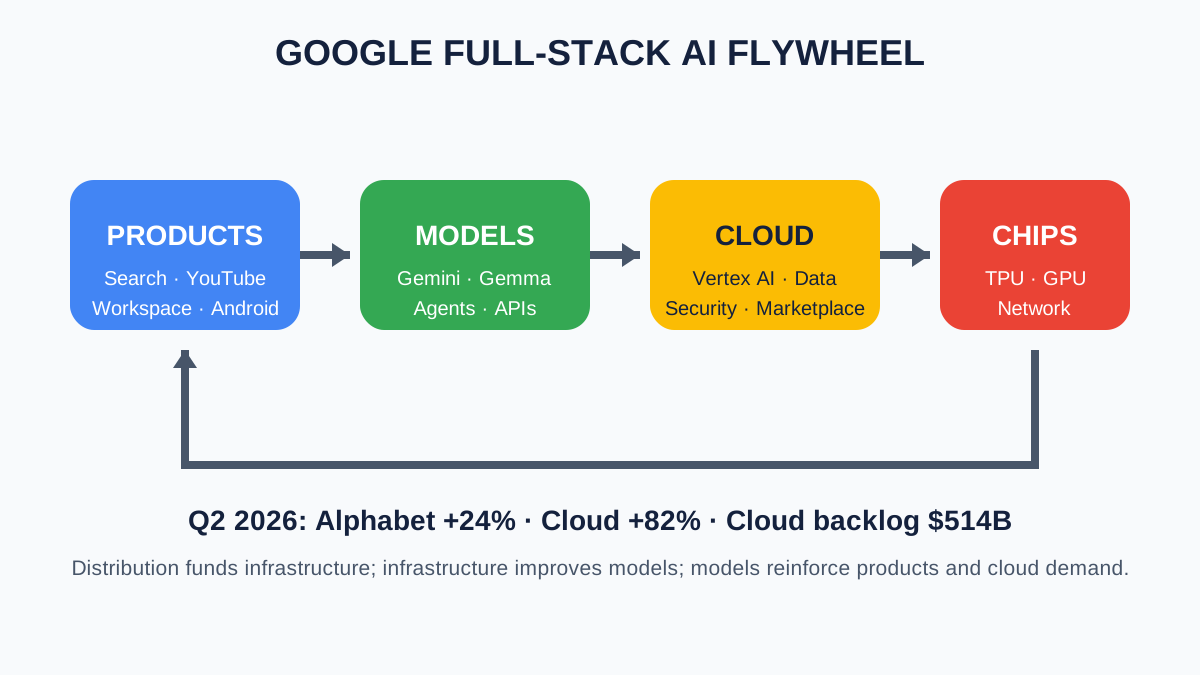
Diagram of the Google products, Gemini, Cloud and TPU flywheel with Q2 2026 metrics

<Google full-stack AI flywheel 1.2>

Sundar Pichai's integration challenge and Q2 2026 acceleration

Larry Page and Sergey Brin made search quality and computing at scale part of Google's technical culture. The creation of Alphabet in 2015 was a way to distinguish the mature Google business from long-duration experiments. Sundar Pichai's current task is harder: protect search-advertising cash flow while moving DeepMind research, Gemini products, Cloud sales, data-center construction, and regulatory responses at compatible speeds.

According to Alphabet's official Q2 2026 CEO remarks, quarterly revenue grew 24% year over year, Search and Other grew 17%, and YouTube advertising grew 13%. Google Cloud was the standout. Cloud revenue grew 82%, while backlog reached $514 billion. Management's case is that AI infrastructure and enterprise-solution demand are now entering reported performance, not merely raising expectations.

Official Q2 2026 metric Result Interpretation
Alphabet revenue growth 24% Advertising, Cloud, and AI products expanded together
Search and Other growth 17% Core engine grew during the AI transition
YouTube advertising growth 13% Video distribution retained ad demand
Google Cloud growth 82% AI infrastructure and solutions accelerated
Google Cloud backlog $514 billion Visibility and supply obligations expanded together

Usage figures reveal the breadth of the system. Alphabet reported 950 million monthly Gemini app users, model API processing of about 22 billion tokens per minute, and more than nine million monthly developers. AI Mode passed one billion monthly users. Management said nearly 90% of the Fortune 100 use Gemini Enterprise, while the Agent Development Kit approached 70 million cumulative downloads. These metrics have different definitions and cannot be added, but they show unusual reach across consumers, developers, and companies.

Adoption metrics do not prove revenue quality on their own. A free user and a paid token have different economics; a pilot and an enterprise standard have different retention. Cloud backlog also becomes revenue on schedules affected by supply and implementation. Buyers and investors should care less about how many people tried a product than about repeat usage, inference unit cost, renewals, and measurable work outcomes.

The strength and cost of combining TPUs, Gemini, and Cloud

Google used machine-learning-specific Cloud TPUs internally for years before offering them broadly to Cloud customers. Their purpose is not to eliminate NVIDIA GPUs. Custom silicon gives Google another supply option and a way to co-optimize hardware, compilers, models, and data centers for large recurring workloads. GPUs remain necessary because customers bring CUDA software and diverse models. The product advantage comes from offering both while optimizing selected Google workloads vertically.

Google Cloud tries to turn those heterogeneous resources into one enterprise operating layer. Data sits in BigQuery and databases; models run through Vertex AI and Gemini APIs; identity, audit, and threat controls govern access. An enterprise agent must do more than generate sentences. It must reach approved data, call tools, execute actions, and leave an accountable record. Governance and integration therefore determine production adoption at least as much as benchmark performance.

The promise of integrated chips, models, data, security, and agent platforms also overlaps with the Palo Alto Networks review of AI security. Prompts, models, data pipelines, and agent actions become new attack surfaces as workloads grow. Google is making Wiz integration and threat intelligence part of the Cloud case, but owning many security products is not the same as applying consistent protection across a customer's environment.

Alphabet's moat is less one model benchmark than its ability to connect Search, YouTube, and Android distribution with DeepMind research, TPUs, networking, and Cloud sales. The same integration concentrates immense capital requirements and regulatory responsibility inside one company.

Capital intensity is the central change. Longer reasoning, video generation, enterprise agents, and Cloud contracts require more servers and data centers. Insufficient capacity loses revenue despite demand; excessive construction raises depreciation and power costs before usage arrives. Management's statement that it reduced AI Mode response cost is technical progress, but it also signals that search economics require continuous optimization.

Advertising, regulation, the open web, and the final assessment

Advertising transition is the first risk. Direct AI answers can reduce clicks to publishers and websites. Google says AI features send billions of clicks to the web each week, but traffic quality and revenue distribution matter as much as volume. A weaker publishing ecosystem would eventually leave Search with less fresh information to index and cite.

Antitrust and platform regulation are the second risk. Search defaults, advertising technology, Play distribution, and data combinations face scrutiny across jurisdictions. The more tightly Google integrates products, the more regulators may see advantages that competitors cannot reproduce. Contract limits, remedies, or structural separation could affect product roadmaps and profitability directly.

Competition and model commoditization are third. OpenAI, Anthropic, Meta, and open models can narrow performance gaps rapidly. Google's response is to distribute models through Search and Cloud immediately and lower cost through TPUs. If customers favor multi-model systems, however, data portability, evaluation, and standard interfaces become more valuable than lock-in to one model.

Other Bets and organizational complexity form the fourth risk. Waymo and similar projects create valuable long-term options but require capital and management attention. Running advertising, Cloud, consumer hardware, autonomous vehicles, and foundational research together enables technical sharing; it can also blur accountability and investment priorities.

Alphabet is a full-stack platform that invests search-advertising cash in AI infrastructure, uses that infrastructure to improve Gemini and Cloud, and returns the result to consumer products and enterprise demand. Q2 2026 revenue growth of 24%, Cloud growth of 82%, and $514 billion of backlog show a powerful flywheel. The durable indicators are not user counts alone. Advertising yield and web traffic in AI Search, recurring paid tokens, backlog conversion, actual TPU economics, data-center returns, and the regulatory limits placed on integration will determine whether the loop compounds.

Saturday, August 1, 2026

Microsoft Company Review — Vertical Integration From Azure to Copilot

The Microsoft AI platform reflects a company changing from a vendor of Windows and Office into one that connects corporate work data, cloud infrastructure, and AI agents inside one identity system. Azure supplies compute and storage; Microsoft 365 and Dynamics hold work context; GitHub controls much of the development flow; and Copilot puts a common interface in front of those assets. Maia accelerators and Cobalt CPUs now extend the company downward into silicon.

This Microsoft company review focuses on the economics of vertical integration rather than listing Copilot features. It asks how data-center investment returns through Azure consumption and application subscriptions, why the OpenAI relationship and internal models and chips are needed at the same time, and how supply constraints and depreciation create risk behind rapid growth. Financial figures follow the official third quarter of fiscal 2026, ended March 31, 2026.

In this review, Azure AI means the full layer connecting compute, data, deployment, and enterprise controls, not merely a model API.

Official Microsoft corporate logo

<Official Microsoft corporate logo 1.1>

Four layers form the Microsoft AI platform loop

The first layer is data centers and silicon. Microsoft deploys NVIDIA and AMD accelerators while designing Azure Boost networking and storage silicon, Cobalt CPUs, and the Maia 200 inference accelerator. The objective is not dependence on one supplier but a portfolio that can lower cost and power for a given workload. Maia 200 emphasizes the economics of repeatedly generating tokens rather than every stage of model training.

The second layer is Azure and the model platform, where customers manage data, security, model selection, evaluation, and deployment. The third layer comprises Microsoft 365, Dynamics, GitHub, and Security applications. They already contain corporate users, permissions, documents, and workflows, giving AI a place to produce action. The fourth layer is operational feedback: more requests provide signals for GPU scheduling, caching, and model routing, and efficiency gains create more available service capacity.

Platform layer Representative assets Revenue model Strategic role
Infrastructure Data centers, NVIDIA/AMD, Maia, Cobalt Azure consumption Capacity and unit-cost control
Data and models Azure, Fabric, Foundry Usage and cloud contracts Model choice plus enterprise data
Applications M365 Copilot, GitHub, Dynamics, Security Seats and consumption AI monetization in existing work
Control Entra, Purview, policy and observability Platform and security revenue Consistent identity and compliance

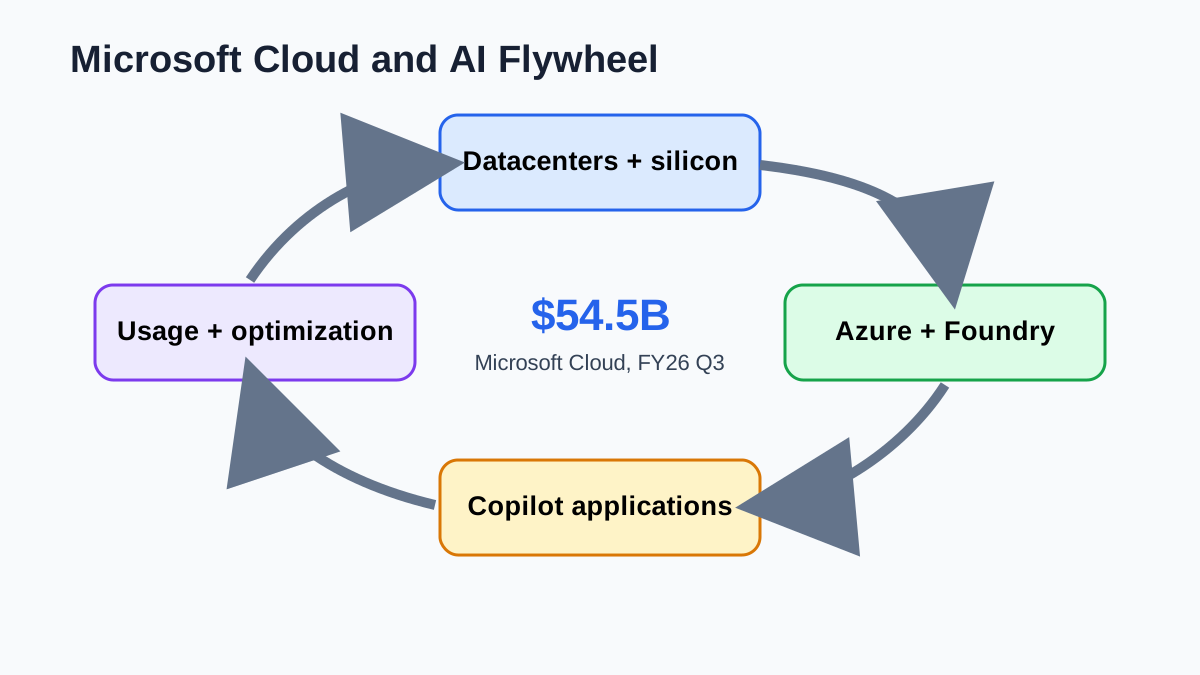
Diagram linking Microsoft data centers, Azure, Copilot applications, and optimization

<Microsoft cloud and AI value loop 1.2>

One product can reduce the selling cost of another. Microsoft can offer GitHub Copilot to an Azure customer, run a Microsoft 365 customer's agents on Azure, and extend Entra permissions and Purview policy to both. Bundling is not automatically customer value, however. Complex licensing or an unclear boundary between existing features and Copilot charges can cause customers to remove unused seats and buy lower-cost specialist tools for selected jobs.

Satya Nadella's two priorities and an $82.9 billion quarter

CEO Satya Nadella described two priorities on the Q3 FY2026 call: build cloud and AI infrastructure for agentic computing, and build high-value agentic systems in productivity, coding, and security. Infrastructure alone faces commodity pricing; applications alone remain exposed to outside compute costs. Owning both layers lets Microsoft connect supply and demand internally.

Microsoft's Q3 FY2026 release reported revenue of $82.9 billion, up 18% year over year. Operating income rose 20% to $38.4 billion, and GAAP net income increased 23% to $31.778 billion. Microsoft Cloud revenue was $54.5 billion, up 29%, while Azure and other cloud services grew 40%. The disclosed annual revenue run rate of the AI business exceeded $37 billion, growing 123%.

Q3 FY2026 metric Result Interpretation
Total revenue $82.9 billion 18% year-over-year growth
Operating income $38.4 billion 20% year-over-year growth
Microsoft Cloud $54.5 billion 29% year-over-year growth
Azure growth 40% Demand across AI and non-AI workloads
Quarterly capital expenditure $31.9 billion CPUs, GPUs, and long-lived facilities
AI business ARR More than $37 billion 123% year-over-year growth

The cost structure matters as much as growth. Quarterly capital expenditure was $31.9 billion, and roughly two-thirds went to shorter-lived assets, mainly GPUs and CPUs. The balance funded sites and facilities intended to monetize for at least 15 years. Corporate gross margin was 68%, but AI infrastructure investment and rising AI usage reduced the percentage year over year. Rapid accelerator replacement directly affects depreciation and profitability even with strong operating cash flow.

Maia 200, Cobalt, and Copilot create technical differentiation

The central claim in the official Maia 200 announcement is token economics rather than a single benchmark. Microsoft knows the request patterns of its own services and can coordinate silicon with data-center power, networks, and software. Maia 200 was live in Iowa and Arizona in Q3, and management said it delivered more than 30% better tokens per dollar than the latest silicon then in its fleet. Cobalt CPUs were deployed in nearly half of Microsoft's data-center regions and ran customer workloads including Databricks, Siemens, and Snowflake.

Microsoft is not abandoning outside accelerators. It uses NVIDIA Blackwell GPU systems, AMD products, and internal silicon according to workload. Internal chips are a way to improve negotiating leverage and selected workload efficiency, not necessarily a single replacement bet. Hiding hardware choice behind Azure APIs lets customers evaluate throughput, latency, and price rather than a processor brand.

Distribution is the application advantage. Paid Microsoft 365 Copilot seats exceeded 20 million, while GitHub places AI inside coding and review. An enterprise agent that reads email, creates documents, and changes systems needs identity, least privilege, audit logs, and data boundaries in addition to model quality. Microsoft connects Entra, Purview, and its security portfolio as that control layer.

Seat count alone does not prove productivity. Enterprises need active-use rates, completed tasks, human review time, errors, and security incidents. As with GitHub Copilot coding agents, greater execution authority makes verifiable changes and approval boundaries more important than faster generation.

Microsoft's AI advantage is not one model. It is the ability to place enterprise data and permissions, Azure compute, and development and work applications inside a shared operating boundary. Only sustained usage converts that integration and data-center spending into a platform moat.

Capital expenditure, capacity, concentration, and conclusion

Investment pace is the first risk. Microsoft says demand exceeds supply and is adding capacity aggressively. Delays in power, transformers, construction, GPUs, or memory postpone revenue even when contracts exist. The opposite mismatch is equally important: if capacity arrives faster than AI usage, depreciation and energy costs pressure margins. Q3 free cash flow of $15.8 billion, reflecting higher capital expenditure, illustrates the balance.

The OpenAI relationship is the second risk. It stimulates Azure demand and product development while adding complexity to investment results, capacity commitments, and model dependence. Offering multiple models through Foundry and developing internal models and silicon increases optionality. Regulation and bundling are the third risk. Joining cloud, productivity, security, and AI can simplify operations for customers but may look like leverage from one market to another to competition authorities. Security is the fourth. Agents with more corporate data and execution rights increase the potential impact of prompt injection, excessive permissions, and leakage.

Microsoft is building a vertical platform from compute to work execution, not merely selling AI models. Revenue of $82.9 billion and 40% Azure growth show demand; $31.9 billion of capital expenditure shows the cost of turning demand into supply. The indicators to follow are Copilot active usage, Azure capacity constraints, realized Maia and Cobalt unit-cost gains, cloud gross margin, free cash flow relative to capital spending, and security outcomes—not AI ARR alone. When infrastructure and applications raise each other's utilization, they form a powerful loop. When unused seats and idle compute accumulate, the same vertical integration becomes fixed-cost risk.

404 Dev Room 30 - Taming

Series · 404 Dev Room Webtoon · Ongoing Episode 30 · 404 Dev Room 30 - Taming The trainer in the AI coding room has changed. <...